High-Lift Devices
In a previous post I introduced the concept of boundary layer separation and how aquatic animals actively or passively morph their skins to delay this phenomenon. As a brief recap, when flow over a surface encounters an adverse pressure gradient (i.e. the fluid pressure increases in the flow direction) the fluid has to work against this increasing pressure, which leads to momentum losses and decelerations in flow. A classical example where this occurs is after the point of maximum thickness in an aircraft wing (Figure 1). The flow speed in the boundary layer close to the surface continues to decrease in the direction of the adverse pressure gradient until at some point the slowest moving fluid close to the wall will change direction. This is called boundary layer separation and leads to a larger wake of vortices forming behind the body. These vortices not only lead to greater pressure drag on the body but also compromise the amount of upward lift the aerofoil can produce, in effect reducing the efficiency of the wing.
An aircraft is lifted up in the air by the net pressure difference between the top and bottom surfaces of the wing. The bottom surface of the wing is known as the pressure surface while the top is called the suction surface. This is because the cambered shape of the aerofoil and the angle of attack α with respect to the flight direction redirects the flow such as to produce a higher fluid pressure on the bottom than the top surface, resulting in a net upwards lift force L. The amount of lift force an aerofoil produces is characterised by the lift coefficient CL,
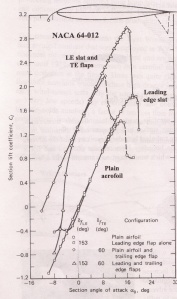
Equation (1) shows that the lift that the aerofoil generates can be increased by flying quicker (V), increasing the density of the fluid (ρ – generally fixed by nature), the planform area of the wing (S – generally fixed by construction) the lift coefficient CL. Now during take-off and landing the velocity of the aircraft is limited by the length of the runway. During take-off the aircraft can only achieve a certain speed before reaching the end of the runway, while during landing the aircraft must be able to break in the space available on the airfield. While moving at the typical take-off and landing speeds of 300 km/hr a typical wing is not capable of producing enough lift to keep the aircraft from falling out of the sky. Luckily, the lift coefficient CL can be enhanced by various parameters such as increasing the camber of the wing or the angle of attack α. Various experiments have shown that the lift coefficient CL increases linearly with angle of attack α (Figure 2). The downside is that the adverse pressure gradient over the aerofoil and profile drag on the wing increase at the same time. At some critical angle of attack the boundary layer starts separating towards the trailing edge of the aerofoil resulting in a precipitous drop of the lift coefficient with any further increases in α. This phenomenon is known as aerodynamic stall, and αstall (around 14° for a typical plain aerofoil) corresponds to the angle of attack at which the maximum lift coefficient CLmax is achieved (around 1.4 for ordinary wing). Videos of an aircraft stalling during flight can be quite dramatic as the pilot attempts to regain control of the spiralling aircraft and often end with the deployment of the ejector seat.
As you might intuitively expect the maximum angle of attack also depends on the velocity of the aircraft, as higher fluid flow will delay flow reversal. This means that during cruise when the air velocity V is high the aircraft flies with a low lift coefficient configuration in order to decrease higher profile drag at large angles of attack. During take-off and landing however the aircraft must increase the angle of attack in order to compromise for the low flight velocity. The issue is that for modern, heavy jumbo jets the typical CLmax of 1.4 is not enough to lift the aircraft from the ground, and any further increases in angle of attack would of course lead to the precipitous drop in CL of aerodynamic stall.
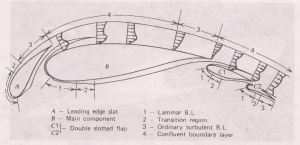
To avoid separation of the boundary layer engineers use high-lift devices such as slats and flaps, which you have probably seen deployed from the leading and trailing edges of the wings respectively. Leading-edge slats are additional thin aerofoils deployed at the front of the main aerofoil, which channel secondary airflow from the bottom of the main airfoil through a gap into to the primary airflow above (Figure 3). This secondary flow injects additional high momentum fluid into the boundary layer on the upper surface and consequently modifies the adverse pressure gradient and delaying boundary layer separation. Similarly, trailing-edge flaps are placed at points where the boundary layer would naturally start to separate from the surface, and invigorate the “tired” boundary layer by the same mechanism. In this manner the critical stalling angle astall is increased and the aerofoil yields a higher value of CLmax often around 2.8 (double the plain aerofoil).
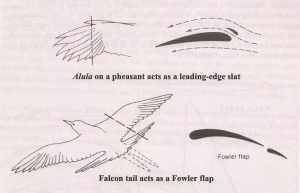
Nature has provided the perfect laboratory for the evolution of aerofoils and similar to many other engineering innovations leading-edge slats and trailing-edge flaps are mimicked from bird flight. The sketches below show that the pheasant uses the front Alula feather as a leading edge slat, while the tail of the Falcon takes the form of a trailing edge flap (Figure 6). Many research institutes are currently spending considerable amounts of money into the development of other shape morphing mechanisms exhibited by birds such as ruffling of feathers, increasing the camber of the wing, lengthening the span or inducing a degree of surface roughness. However, these technologies require materials that are compliant enough to rapidly deform into the required shape, while stiff enough to resist the aerodynamic loads. Unfortunately our current material systems do not facilitate such capabilities.

Fig. 5 The position of the leading edge slats on an airliner (Airbus A310-300). (Photo credit: Wikipedia)
References
(1) http://www.centennialofflight.gov/essay/Theories_of_Flight/Skin_Friction/TH11G3.htm
(2) Lock, G.D. (01. 2009). “Fluid Mechanics with a Historical Perspective”. University of Bath. Bath, UK
Related Posts
4 Responses to High-Lift Devices
Leave a Reply Cancel reply
This site uses Akismet to reduce spam. Learn how your comment data is processed.
Sign-up to the monthly Aerospaced newsletter
Recent Posts
- Podcast Ep. #49 – 9T Labs is Producing High-Performance Composite Materials Through 3D Printing
- Podcast Ep. #48 – Engineering Complex Systems for Harsh Environments with First Mode
- Podcast Ep. #47 – Möbius Aero and MμZ Motion: a Winning Team for Electric Air Racing
- Podcast Ep. #46 – Tow-Steered Composite Materials with iCOMAT
- Podcast Ep. #45 – Industrialising Rocket Science with Rocket Factory Augsburg
Topics
- 3D Printing (4)
- Aerodynamics (29)
- Aerospace Engineering (11)
- Air-to-Air Refuelling (1)
- Aircraft (16)
- Autonomy (2)
- Bio-mimicry (9)
- Case Studies (15)
- Composite Materials (25)
- Composites (7)
- Computational Fluid Dynamics (2)
- Contra-Rotation (1)
- Design (2)
- Digitisation (2)
- Drones (1)
- Education (1)
- Electric Aviation (11)
- Engineering (23)
- General Aerospace (28)
- Gliders (1)
- Helicopters (3)
- History (26)
- Jet Engines (4)
- Machine Learning (4)
- Manufacturing (12)
- Military (2)
- Modelling (2)
- Nanomaterials (2)
- NASA (2)
- New Space (11)
- News (3)
- Nonlinear Structures (1)
- Novel Materials/Tailored Structures (14)
- Personal Aviation (5)
- Podcast (45)
- Propulsion (9)
- Renewable Energy (2)
- Renewables (1)
- Rocket Science (17)
- Satellites (8)
- Shape Adaptation (1)
- Smart Materials (1)
- Space (12)
- Space Junk (1)
- Sport Airplanes (2)
- Startup (19)
- STOL (1)
- Structural Efficiency (5)
- Structural Mechanics (1)
- Superalloys (1)
- Supersonic Flight (2)
- Technology (18)
- UAVs (2)
- Virtual Reality (2)
- VTOL (3)
- Privacy & Cookies: This site uses cookies. By continuing to use this website, you agree to their use.
To find out more, including how to control cookies, see here: Cookie Policy


interesting read. I love your blog. keep writing.
cheers!
Glad you enjoy it!
Thank you for the article. Please post an article on high lift devices for low Reynolds Numbers (high viscosity flow). Drones and other air vehicles commonly fly at Reynolds Numbers between 30,000 and 100,000 which requires much different designs than large aircraft flying at Reynolds Numbers over a million. Please comment on the lack of on compressability changes due to Reynolds Number and how it affects cove shapes for slats and flaps.
Very good, really top notch content. Aspiring pilot cum teacher here, your blog definitely helped me out.