Fundamentals versus Finite Elements: A case study on the Fokker D-VII Biplane
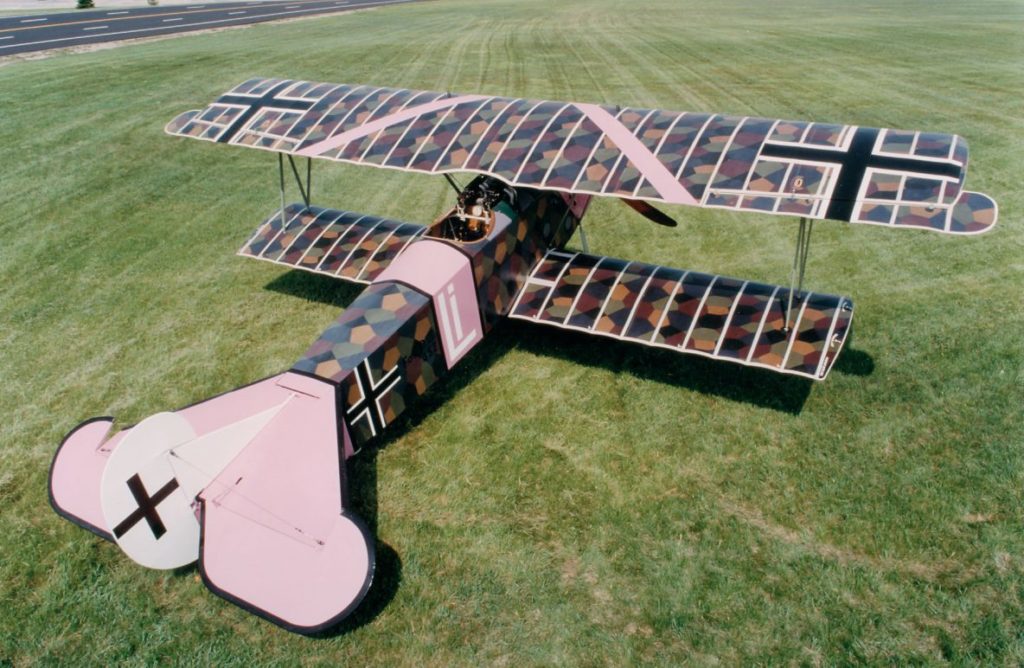
This post is a first. Up to now, all content on this blog has been exclusively written by myself. But recently Nick Mehlig and Ben Names from Structural Design and Analysis, Inc. (SDA), a team of stress engineers that design lightweight and load efficient structures, contacted me with a proposal for a guest post. The reason why I agreed is because the guys at SDA have a unique perspective on a fascinating real-world engineering problem — re-designing the wing of a Fokker D-VII. The Fokker D-VII was a German fighter aircraft in World War I but was also used by many other countries after the Great War. This post is a look at some of the details of how aircraft components are designed.
Within the Aerospace Engineering community, there is an entire sub-discipline devoted to understanding the dynamics of a system and how loads are generated (propulsive, inertial, aerodynamic, etc). In smaller companies, engineers often need to wear multiple hats, and the lines between classical stress analysis and aerodynamic loads analysis begin to blur. Recently, Structural Design and Analysis, Inc. (SDA) worked with a local resident who had taken it upon himself to build a Fokker D-VII Biplane from scratch, and wanted to know how much weight he could save if he used an aluminium spar for the main wings instead of the original wooden spar design.
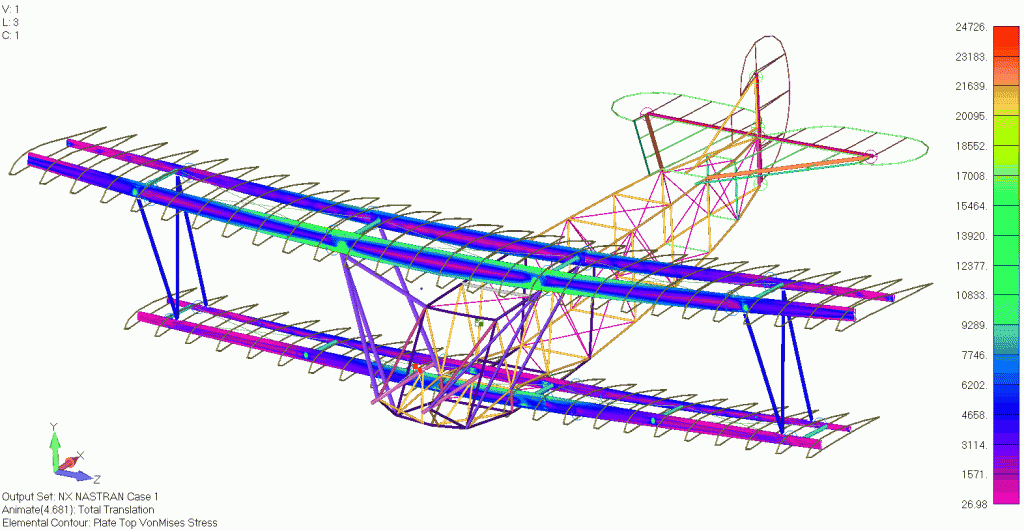
Our engineers had to develop a finite element model (FEM) and conduct the basic loads and dynamics analysis to define the load cases for the vehicle. Generating aerodynamic loads is relatively straight forward for aircraft with more conventional designs. Typically, a combination of 2D aerodynamic theory and corrections for wings with finite span are used to generate the loads in the early stages of the design phase. These loads are then applied to the structure at the quarter chord location of the wing. For the Fokker, this analysis is slightly more complicated because the biplane construction creates interference effects between the upper and lower wing which must be considered when determining the loads that act on the aircraft.
The goal of this case study is to show that various approaches can be taken to solve this loads-generation problem, and that the “best” approach for an engineer depends on his/her technical expertise, available resources (time and/or money), and the desired accuracy of the results. Three different methods were selected to calculate the aerodynamic loading on the Fokker D-VII biplane, and they are listed in increasing order of required technical expertise and accuracy:
- Assuming that each wing can be analysed separately. This type of solution is best suited to an aircraft enthusiast or an engineer without much background in theoretical aerodynamics.
- Accounting for the interaction between the upper and lower wing using correction factors. This type of solution is best suited for an engineer with a level of understanding comparable to an undergraduate education in aerospace engineering.
- Using an advanced FEM analyses suite such as NX Nastran’s Static Aeroelastic SOL 144. This solution technique requires the least amount of effort on the user since the loads are calculated internally by NX Nastran, but is best suited to an engineer with some postgraduate education in aerospace engineering.
Let’s compares the efficacy of these three methods and the accuracy of their respective results.
Method 1
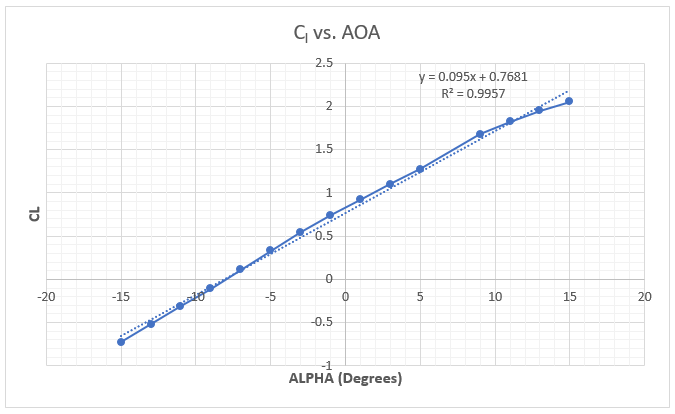
The first step in calculating the aerodynamic loads on the aircraft is to get the airfoil data. The Fokker D-VII uses a modified Goettigen GOE 418 airfoil for the upper wing. The airfoil data points (see the diagram below) were imported into XFOIL, a popular open-source 2D potential flow code, and the lift coefficients were extracted for various angles of attack (AOA). Using the XFOIL data, a plot relating the wing’s AOA to the lift coefficient () is constructed. A trendline is added to the data to estimate the lift curve slope for the airfoil of
and the zero lift AOA is
(the airfoil is angled down for no lift).
To calculate the lift on the upper and lower wings, a simple approximation from Prandtl Lifting Line Theory is used which relates the 3D lift coefficient to the 2D lift curve slope, the wing aspect ratio (AR) and the AOA. The lower wing of the Fokker D-VII has a AOA while the upper wing has
AOA.
The lift equation was then used to calculate the lifting force on the wings.
where is the wing area and
is the dynamic pressure that depends on the density
and the airspeed
of the particular manoeuvre.
To balance the aircraft, the moment created by the wing lift about the centre of gravity of the Fokker needs to be balanced by the tail wing lift force, . Each moment is equal to the lift force multiplied by the distance of the point of action
from the centre of gravity of the aircraft. Given the relative positions of the two wings and the tail plane, we solve the following equation
The sum of these three loads is lb or 4.31g’s. Since we are analysing a 4.0g load case here, the lift on the wings will need to be reduced. As the lift on the wings is reduced, the pitching moment will change which, in turn, changes the required tail force to balance the aircraft. Excel’s goal seek was used to reduce the wing loading and balance the aircraft such that the total lift (including the tail) is equal to 4.0g. The final loads are shown below.
lb
lb
lb
These final loads are applied to the quarter chord location of the wings. Here, a rectangular spanwise lift distribution is applied to the upper and lower wings.
Method 2
By having two wings subject to the same flow, each wing interacts with the other’s vortex system such that the upper wing experiences an increase in lift and the lower wing experiences a decrease in lift, denoted by and
respectively. The following method uses the simple biplane theory which is detailed in NACA Technical Report No. 458 [1]. It is shown that the change in lift coefficient
follows a linear relation with the overall vehicle lift coefficient
in the following form:
Where and
are constants relating to the gap between the two wings, wing stagger (the relative fore-aft position of the two wings), decalage (angle difference between the upper and lower wings of the biplane), overhang (the extension of one wing span over the other), and wing thickness. The change in lift for the lower wing is related to the change in lift of the upper wing by the ratio of wing areas.
The methods of finding the values of and
follow a graphical approach using the biplane ratios of wing gap = 55 in., wing stagger = 25 in. , percent wing overhang = 17.4%, and decalage = 1 deg. Using these values and the method described in NACA Report 458, the following values are calculated:
and
. The final lift coefficient for the upper and lower wings are found by adding the correction to the vehicle lift coefficient to the original uncorrected value. This uncorrected value is calculated from the maximum weight of the aircraft, which naturally determines the lift required from the wings. The maximum weight of the Fokker D-VII is 1,259 lbs, and for a 4.0g manoeuvre (n=4 in the equation below), the aircraft lift coefficient is:
Plugging in values for ,
and
into the
and
equations give the following values:
and
Using the new corrected values for the wing coefficients and
, the total load can be calculated for the upper and lower wings. A moment balance is performed and the following loads are calculated for the aircraft:
lb
lb
lb
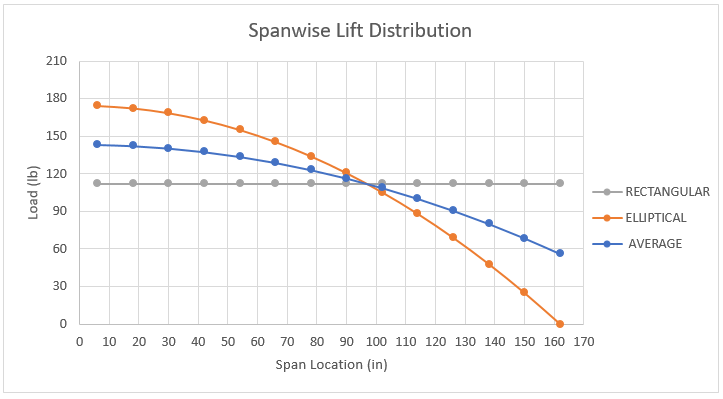
Again, the loads are applied to the quarter-chord position of the aircraft wings. Two different spanwise lift distributions are applied to the model for this comparison study. The first assumes an elliptical lift distribution. The second uses Schrenk’s Approximation to estimate a more accurate spanwise lift distribution. These two distributions are shown below along with a reference to a rectangular distribution.
Method 3
The third and final method is to use NX Nastran’s static aeroelastic SOL 144 analysis to generate the loads using a vortex lattice formulation. A potential flow model is created in FEMAP to generate the aerodynamic loading for the Fokker. One of the powerful functionalities about SOL 144 trim analysis is that given high-level information about any flight condition, Nastran cannot only calculate the aerodynamic forces, but can also ensure that the vehicle is stable. With just a few clicks, the load case can be modified to model any corner of the flight envelope by changing the dynamic pressure and load factor of the aircraft. Since Nastran calculates all the loads internally using this high-level flight condition information, it can save an incredible amount of time that might be devoted to calculating loads externally, bringing them in, and applying them to the structure accurately. This solution requires the least amount of effort on the user since the loads are calculated internally by NX Nastran and then applied to the FEM through the points defined in the model. NX Nastran automatically calculates the trim condition of the aircraft and calculates the loading on the upper wing, lower wing, and horizontal tail. The resulting loads are shown below:
lb
lb
lb
Results
As the complexity increases with each of the methods discussed above, so does the accuracy of the results. However, not every stage of the design requires the same precision. Since this discussion focuses on how the analysis approach impacts the design of the aircraft, let us first compare the calculated loads for all three methods. Below is a table outlining the loads for each method and the percentage difference when compared to the aeroelasticity finite element model (the most accurate loads generation approach).
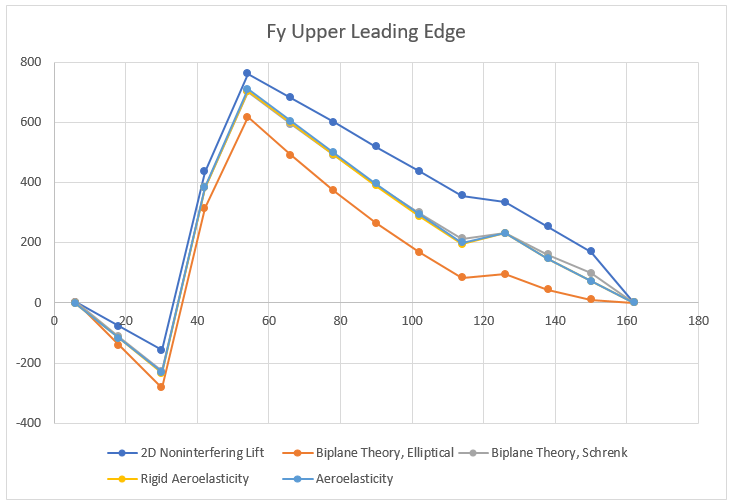
When comparing the lifting force of upper and lower wings of the aircraft, the aerodynamic loading from method 1 underestimates the lift on the upper wing by 10.2% and over estimates the lift on the lower wing by 22.5%. Applying Simple Biplane Theory in method 2 captures the interference effects and estimates the wing loading much more accurately with the upper wing lift only 2.6% less and the lower wing lift 6.3% greater, when compared to the aeroelastic model. A more detailed way to compare the resulting design impact of the three different load generation methods is to look at the internal shear and bending moment diagrams within the spars. Below is the shear force diagram for the upper wing leading edge spar.
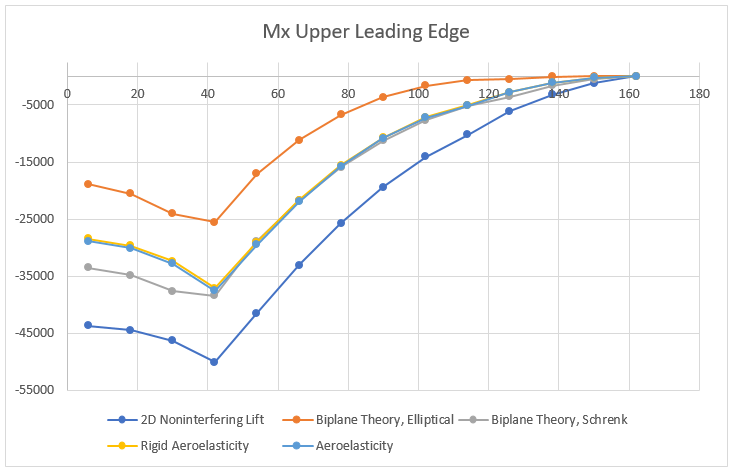
Starting with the simplest method, the 2D non-interfering lift generates the highest shear force. As one would expect the variation in the maximum internal shear force is small (at most 7% difference) over all the models since the total lift generated by the plane was set to be constant. The differences are partially due to how the lift is distributed between the upper and lower wings. Furthermore, the spanwise distribution clearly has an impact on the internal shear force. Interestingly, the model that matches the shear force of the aeroelasticity model the closest is the Biplane Theory model using Schrenk’s approximation. The differences produced by these aerodynamic models becomes even more apparent when inspecting the internal bending moment.
The internal bending moment clearly shows how differences in the aerodynamic models can propagate. The most basic model (2D Non-interfering Lift) produces the highest bending moment, 33% higher than the aeroelastic solution. While it is safer to be on the conservative side, this kind of inaccuracy will lead to a substantially heavier structure, thus limiting performance.
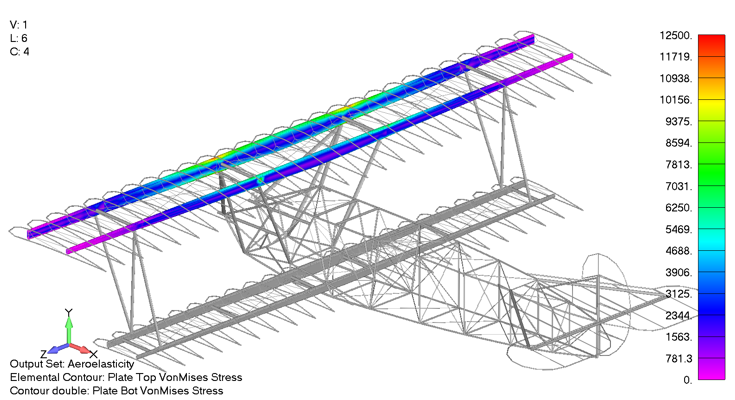
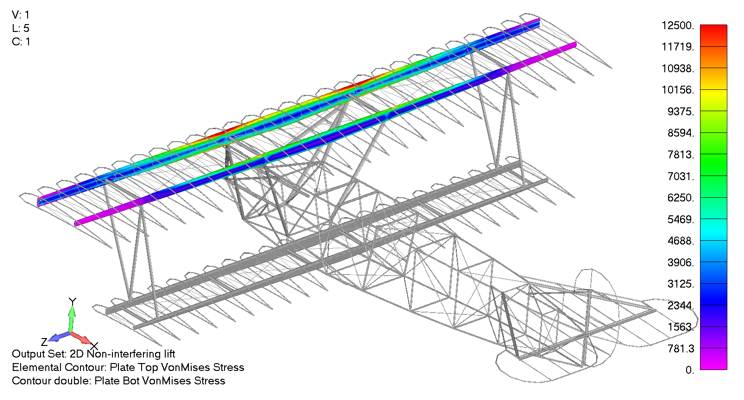
The shear and bending moment diagrams are often excellent indicators of the internal stress state within simple structures. As a stress engineer, comparing stress plots is the most meaningful way to compare how the different aerodynamics models impact the stress throughout the vehicle. Below is a picture of the upper wing leading and trailing edge spars Von Mises stress under a 4g pull up when using the aeroelasticity model.
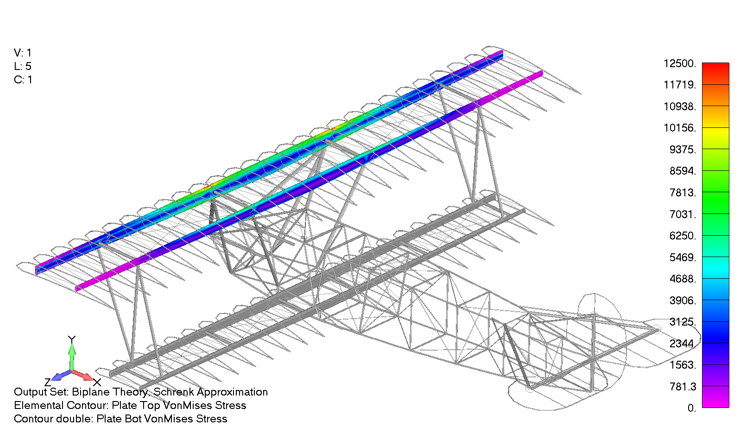
The max spar cap Von Mises stress is 11.4 ksi. In comparison, the same stress contour is presented below, only for the case using the Biplane theory using Schrenk’s approximation, which exhibited a maximum Von Mises stress of 11.5 ksi, a 0.8% difference from the aeroelastic aerodynamic model.
In contrast, the Von Mises stress state for the upper wing under the 2D non-interfering lift can be seen below as a gross overprediction, predicting a maximum Von Mises stress of 15.2 ksi, 33% higher than the aeroelastic aerodynamic model.
Conclusion
Having exhaustively explored the impact of different aerodynamic models on the final stress results, several conclusions have become clear. First and foremost, as laid out at the beginning, none of these approaches are inherently bad. However their mileage does vary significantly. Requiring the least technical background, the 2D non-interfering lift model provides a good approximation of the stress state in the leading and trailing edges, but is over-conservative in predicting internal stresses. As expected, including the interference effects between the upper and lower wing in the simple Biplane Theory and applying finite span effects has the potential to predict stresses within 0.8% of the most accurate model. Unfortunately, this relies on the user correctly calculating the span wise loading and interference effects which often requires complex analytical methods or using a potential flow method. Furthermore, there are ample opportunities for an engineer to make a mistake when taking this approach, and it could be difficult to detect these without the results of a more accurate model to compare to.
Now, given that fairly accurate stress distributions using semi-analytical methods can be achieved, you might be asking yourself, why might anyone want to spend the money to use the NX Nastran Aeroelasticity module? First, it removes substantial uncertainty in the accuracy of the aerodynamic model. The Nastran Aeroelasticity module can account for interfering lifting surfaces, slender fuselage effects, ground effect, compressibility, wing sweep and taper, as well as a number of other factors. Additionally, once implemented, the Nastran Aeroelasticity module is more flexible than generating the loads from an outside source and then applying those loads within FEMAP (the pre/post environment). Nastran can generate the loads for any flight condition such as steady level flight, a 4g pull up, or a 3g coordinated turn, requiring only high level information from the user.
Finally, the user is also provided with additional information such as the trim angle of attack, control surface deflection angles, and vehicle stability derivatives. As with most problems, there is rarely a single correct approach, but when high accuracy and case-generation flexibility are desired, then using NX Nastran’s Static Aeroelastic Solution 144 is the way to go. However, if you are working on a budget, can take on additional mass, or do not have the technical background to employ Solution 144, then using an analytical method or generating the loads some other way externally is probably the way to go.
References
[1] Diehl, W. S., “Relative Loading on Biplane Wings,” NACA TR-458, January 1934
Related Posts
2 Responses to Fundamentals versus Finite Elements: A case study on the Fokker D-VII Biplane
Leave a Reply Cancel reply
This site uses Akismet to reduce spam. Learn how your comment data is processed.
Sign-up to the monthly Aerospaced newsletter
Recent Posts
- Podcast Ep. #49 – 9T Labs is Producing High-Performance Composite Materials Through 3D Printing
- Podcast Ep. #48 – Engineering Complex Systems for Harsh Environments with First Mode
- Podcast Ep. #47 – Möbius Aero and MμZ Motion: a Winning Team for Electric Air Racing
- Podcast Ep. #46 – Tow-Steered Composite Materials with iCOMAT
- Podcast Ep. #45 – Industrialising Rocket Science with Rocket Factory Augsburg
Topics
- 3D Printing (4)
- Aerodynamics (29)
- Aerospace Engineering (11)
- Air-to-Air Refuelling (1)
- Aircraft (16)
- Autonomy (2)
- Bio-mimicry (9)
- Case Studies (15)
- Composite Materials (25)
- Composites (7)
- Computational Fluid Dynamics (2)
- Contra-Rotation (1)
- Design (2)
- Digitisation (2)
- Drones (1)
- Education (1)
- Electric Aviation (11)
- Engineering (23)
- General Aerospace (28)
- Gliders (1)
- Helicopters (3)
- History (26)
- Jet Engines (4)
- Machine Learning (4)
- Manufacturing (12)
- Military (2)
- Modelling (2)
- Nanomaterials (2)
- NASA (2)
- New Space (11)
- News (3)
- Nonlinear Structures (1)
- Novel Materials/Tailored Structures (14)
- Personal Aviation (5)
- Podcast (45)
- Propulsion (9)
- Renewable Energy (2)
- Renewables (1)
- Rocket Science (17)
- Satellites (8)
- Shape Adaptation (1)
- Smart Materials (1)
- Space (12)
- Space Junk (1)
- Sport Airplanes (2)
- Startup (19)
- STOL (1)
- Structural Efficiency (5)
- Structural Mechanics (1)
- Superalloys (1)
- Supersonic Flight (2)
- Technology (18)
- UAVs (2)
- Virtual Reality (2)
- VTOL (3)
- Privacy & Cookies: This site uses cookies. By continuing to use this website, you agree to their use.
To find out more, including how to control cookies, see here: Cookie Policy





Good,fair,honest comparison.
Excellent article Can you please provide to me the upper wing spar geometry? thx Bob